What Separates These Two Approaches?
Before comparing performance and cost, it helps to understand what's actually happening inside each fund type. If you're newer to how funds work at all, our guide to stocks, bonds, and cash is a useful starting point.
Index funds are passively managed. They hold a predefined basket of securities designed to replicate a market index - the S&P 500, for example - rather than select individual stocks. No analyst team decides what to buy or sell; the fund simply mirrors its target index, rebalancing mechanically when the index changes. The result is broad market exposure at very low operating cost.
Actively managed funds employ a portfolio manager and research team who make deliberate buy-and-sell decisions. Their goal is to outperform the market - or a designated benchmark - through security selection, sector rotation, or timing. That human judgment comes with a cost.
| Criterion | Index Funds | Actively Managed Funds |
|---|---|---|
| Management style | Passive - tracks a benchmark | Active - manager makes decisions |
| Typical expense ratio | 0.03%-0.20% | 0.50%-1.00%+ |
| Portfolio turnover | Low | Higher - varies by strategy |
| Goal | Match market returns | Beat a benchmark index |
| Long-term track record | Outperforms most active funds after fees | Majority underperform index peers over 10+ years |
| Best market fit | Efficient, heavily researched markets | Less efficient, specialized segments |
| Complexity for investor | Low - minimal ongoing decisions | Higher - requires monitoring manager quality |
Understanding this structural difference is what makes the cost comparison meaningful, not just an abstract number.
The Cost Gap and Why It Compounds
The most concrete difference between index and active funds is the expense ratio - the annual fee deducted from fund assets. Index funds in the US often carry expense ratios between 0.03% and 0.20%. Many actively managed funds charge 0.5% to 1.0% or more annually.
~0.05%
Median US index fund expense ratio
According to Morningstar's annual fund fee study, passive fund costs have fallen steadily over the past decade.
Over 80%
Active large-cap funds underperforming S&P 500 over 15 years
S&P Dow Jones Indices SPIVA US Scorecard consistently shows this pattern across long measurement periods.
$30,000+
Estimated 30-year cost difference on a $50K portfolio
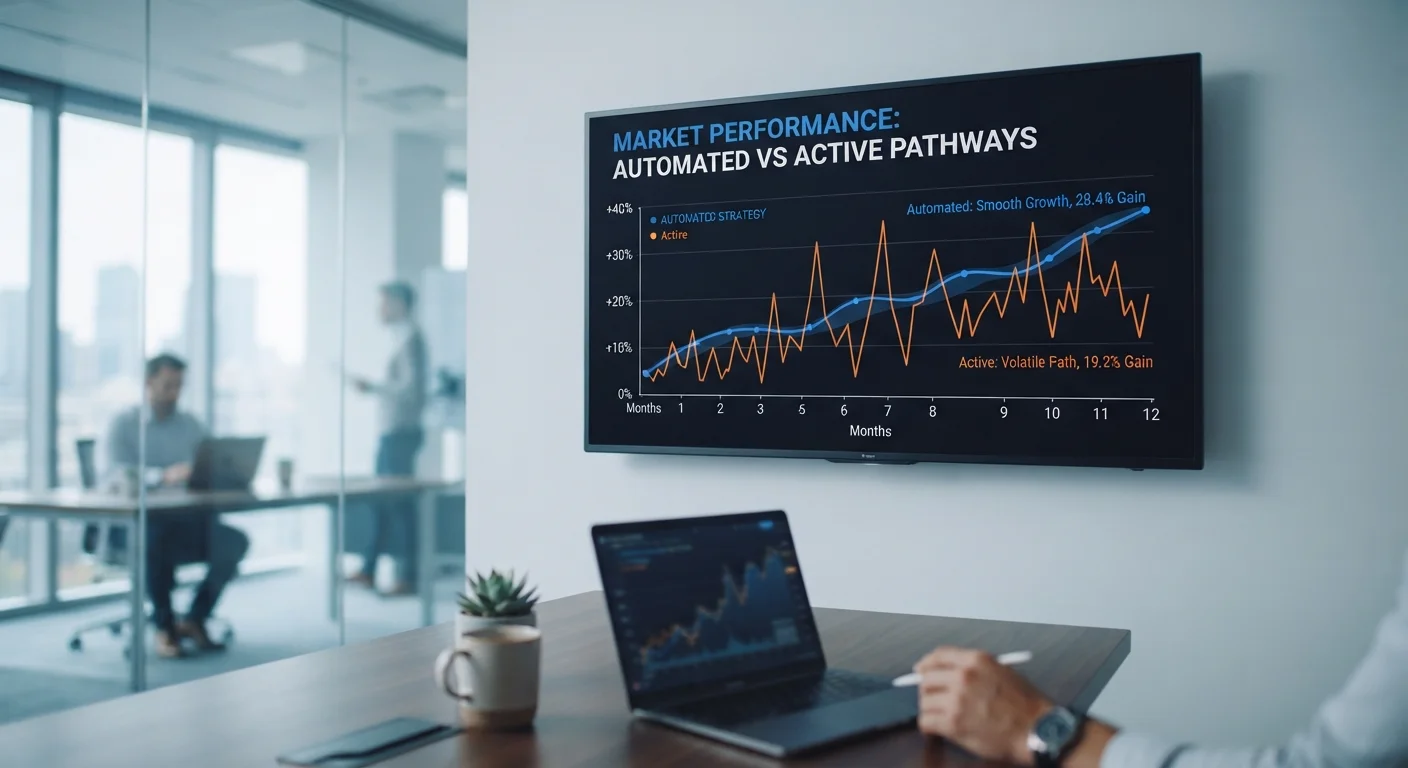
A 0.80% annual fee gap on a $50,000 portfolio growing at 7% annually results in a significant wealth gap purely from costs, independent of returns.
On a $50,000 portfolio earning 7% annually, a 0.80% fee gap translates to tens of thousands of dollars less in ending wealth over 30 years - not because of bad stock picks, but purely due to the drag of fees. This is one of the most reliably documented dynamics in personal finance, and it's one reason cost-awareness matters before anything else. The early investing mistakes that erode long-term returns article explores how ignoring costs quietly undermines portfolios over time.
Transaction costs, tax drag from higher portfolio turnover, and sales loads (charged by some active funds at purchase or redemption) can add further to the real cost gap beyond the headline expense ratio.
What the Performance Record Actually Shows
The S&P Indices Versus Active (SPIVA) scorecard, published by S&P Dow Jones Indices, tracks how actively managed funds perform relative to their benchmark indexes. Across most time periods and categories, the majority of active funds underperform their index equivalent after fees. This pattern is especially pronounced over 10- and 15-year horizons.
There are genuine exceptions. In markets with less analyst coverage - smaller companies, certain international markets, niche sectors - skilled active managers have more opportunity to find mispriced securities. The efficiency argument for passive investing is strongest in large, heavily researched markets like US large-cap equities.
Survivorship Bias in Active Fund Data
Performance comparisons of active funds can be misleading because underperforming funds are frequently closed or merged before they appear in historical databases - a phenomenon called survivorship bias. This means average active fund returns often look better than the full picture. SPIVA addresses this by including defunct funds in its calculations, making its findings more reliable than simple fund-universe averages.
This doesn't mean active management is inherently worthless, but it does mean the burden of proof is on the active fund to justify its cost. When you're evaluating any fund, our guide to reading a fund factsheet walks through exactly which performance and cost data points to scrutinize.
Putting It Into Practice
Most young professionals are best served by starting with a clear portfolio structure before choosing individual funds. See our framework for asset allocation across a working life for how to think about your overall mix first.
A practical approach many financial planners describe is a core-satellite model: the bulk of your portfolio - your core - holds broad index funds for diversified, low-cost exposure to major markets. A smaller satellite allocation, if desired, might include actively managed funds in less efficient segments or other specialized strategies.
This approach lets you capture the cost and diversification benefits of indexing while leaving room to explore active strategies with a contained portion of your portfolio. Whatever allocation you choose, the account type you use - tax-advantaged retirement accounts, taxable brokerage accounts - matters as much as the funds themselves.
This article is intended for general financial education only and does not constitute personalized investment advice. Past fund performance does not guarantee future results. Consult a qualified financial adviser, accountant, or attorney before making decisions specific to your financial situation.